Year of Birth
Are young people today worse off in terms of wealth as compared to their parents? The difficulties for young people to find stable employment and the increases in the starting capital needed to buy a house leads to the expectation that accumulating wealth is more complicated for young adults today as compared to their parents' generation.
Figure 1 shows to what extent this is the case. Comparisons across cohorts are complicated because household wealth changes systematically with age. Wealth increases substantially from young adulthood onward as people start working and can accumulate wealth from savings, investments, or received inheritances. At later ages, wealth is likely to decline as people stop working and start consuming more of their wealth. This pattern of rising and subsequently falling levels of wealth can be roughly observed when we put together information from the different cohorts in our data in Figure 1.
Figure 1 shows that these upward trajectories with age were temporarily interrupted for the cohorts born in the 50s and 60s when the financial crisis hit. Whereas these cohorts ended up reaching very high levels of wealth in recent years, the situation is less favorable for individuals born in the 1970s and 1980s. The 1970s cohort started with similar levels of household wealth around age 30 as compared to the wealth that persons born in the 1960s had in their early 30s. But, instead of embarking on an upward trajectory during their 30s and 40s, the median household wealth of the 1970s cohort declined with age. The same is observed for those born in the 1980s, who are starting at very low levels of median household wealth in their early 30s.
Figure 1. Median Household Wealth by Age and Cohort
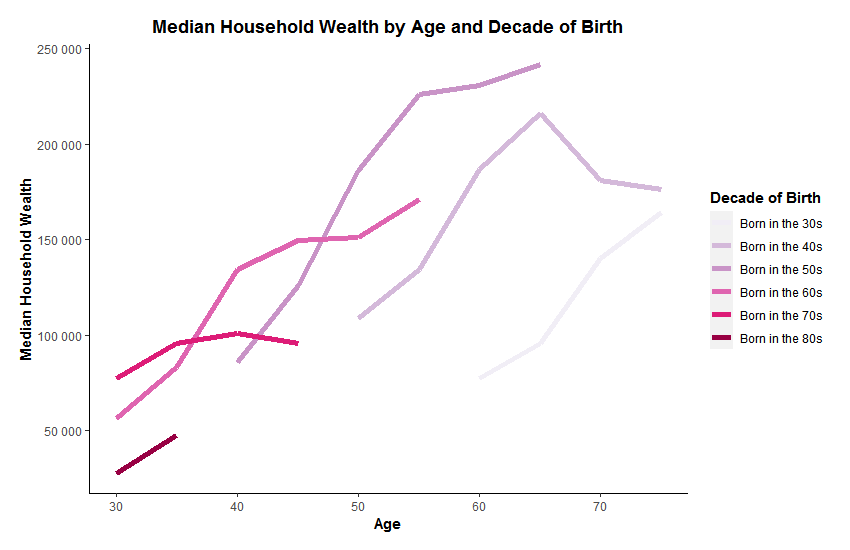
Note. Restricted to heads of household and partners of heads of household
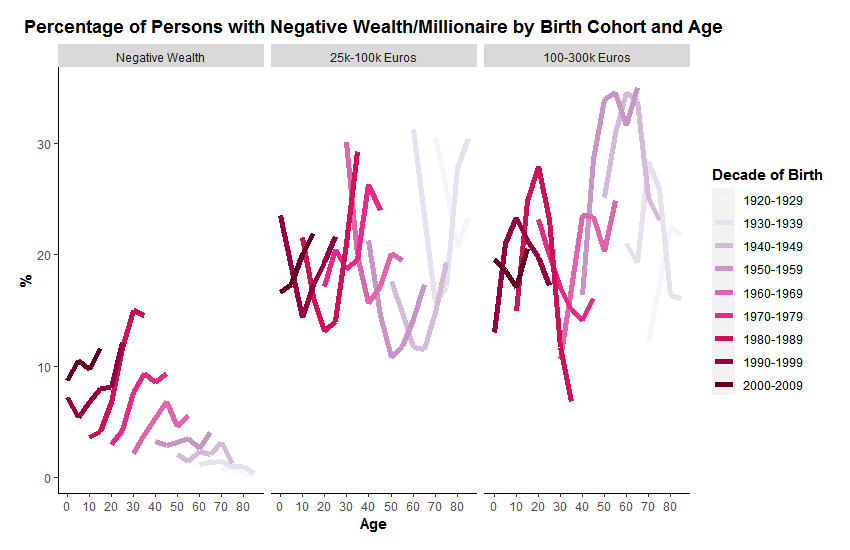
Figure 2 takes a closer look at specific wealth categories and includes all individuals regardless of whether they left the parental home or not (Figure 1 includes only heads of household and partners). The first pane shows the percentage of each cohort living in a household with negative wealth. It becomes clear that the 1970s and 1980s cohorts are almost entirely responsible for the increase in the number of individuals living in households with negative wealth between 2002 and 2017 (See also "Wealth in Spain 2002-2017"). For other cohorts, the share of individuals living in debt decreased steadily with age. Given the difficult economic situation for these cohorts, it is worrisome that the consequences of the covid-19 pandemic are likely to further complicate possibilities for these cohorts to start accumulating wealth. The middle and right pane show how younger cohorts increased their share in the 25.000 to 100.000 euros of wealth group between ages 30 and 40, whereas for the older cohorts many already entered the 300.000 to 1 million euros of wealth group during those ages.
The economic situation of the 1970 and 1980 cohorts is also reflected in the share of children living in a household that has negative wealth. Whereas for those born in the 1980s, growing up in a household with negative wealth was quite rare, more than 10% of children born in the 2000s lived in a household in debt around the age of 10. The obstacles experienced by the 1970s and 1980s cohorts to accumulate wealth might spill over to the next generations because wealth is a resource related to the well-being of children.
Figure 2. Median Household Wealth by Age and Cohort
Discover more about wealth, its distribution across Spanish households, and the characteristics of individuals living in households with little and plenty of wealth by clicking on one of the buttons below.
A gentle introduction to the concept of wealth
FAQ: What is wealth and is wealth inequality important?
Basic trends in household wealth and its distribution in Spain
Who is gaining wealth, who is falling behind?
Income Education and Social Background
This project is financed by the “la Caixa” Social Research Call 2019 (SR0403-WINEQ)