Wealth and its components during an eventful period
Spain is a country where wealth is relatively important as compared to income. The total value of wealth owned by Spanish households is equal to 7 to 8 times Spanish yearly national income. In several other European countries, this "wealth-to-income ratio" is closer to 5 or 6 times national income. This means that the economic resources that people have depend to an important extent on how much they own rather than how much they earn on a monthly or yearly basis. Figure 1 shows how the average wealth held by households developed over time in Spain broken down by components. Once summing all components we get total household wealth. Average household wealth rose from 182.000 to 275.000 between 2002 and 2005 but had declined again to around 250.000 by 2017.
Trends are even more dramatic once looking at median wealth. The median is the household that has less wealth than 50% of the Spanish households, but more wealth than the other 50%. Because very wealthy households pull up the average wealth of households, median wealth is often used as a better indicator of "the middle" of the wealth distribution. Median wealth rose from 113.000 euros in 2002 to 190.000 in 2005 but had declined again to 115.000 by 2017.
Figure 1. Wealth Components 2002-2017

Source: Encuesta Financiera de Familias (Banco de España)
As becomes clear from Figure 1, a large part of trends in wealth is driven by housing. The average value of primary residences skyrocketed in the early 2000s but returned to initial levels in the years after the financial crisis. Given the rapid fluctuations in housing prices, it is unclear to what extent households experienced parallel changes in their standard of living. Households have to sell their house before they can benefit from an increase in the value of their home. Homeowners who did not sell their house during this period might, therefore, have noticed little changes in standard of living.
Figure 2 gives a more concrete indication to what extent households might have entered problematic financial situations during the period studied here. Households are divided into different categories indicating a certain level of absolute wealth. These categories range from being in debt ("Negative") to having more than 1 million euros of wealth. Between 2002 and 2005 we see a general "upgrading" of the distribution. The number of persons living in households with wealth between 25.000 and 100.000 euros halved, whereas the number of persons living in households with more than 300.000 euros of wealth almost doubled. After the financial crisis, this development was reversed again, resulting in a distribution for 2017 that is quite similar to the distribution for 2002. One change that did not revert to its 2002 level is the number of persons living in a household with negative wealth. Households with negative wealth have debts that exceed the value of their assets. The size of this group increased already before the financial crisis and kept increasing after the financial crisis. In 2017, almost 1 out of 11 individuals lived in a household with negative wealth.
Figure 2. Distribution of Individuals across Wealth Groups
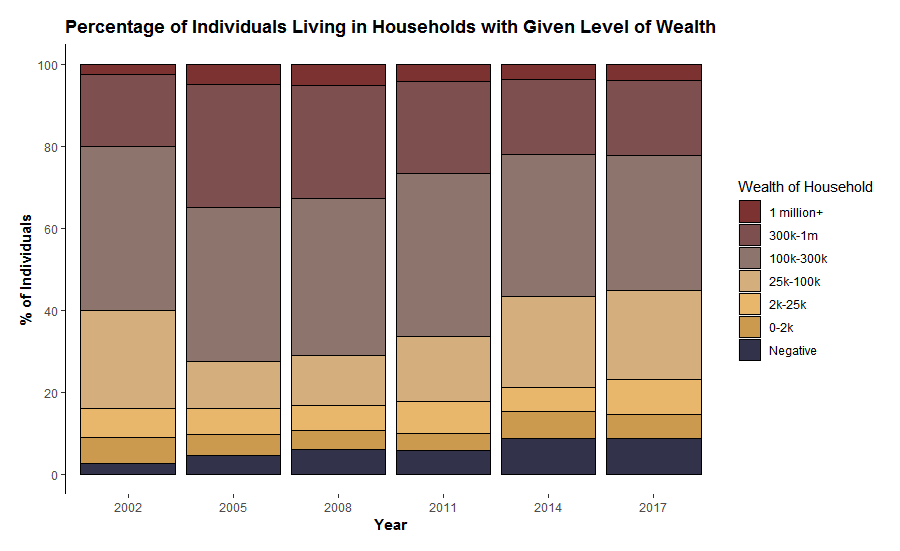
Source: Encuesta Financiera de Familias (Banco de España). In 2017 euros.
Figure 3 shows how the composition of wealth has changed over time for persons living in households with negative wealth. In 2002, households with negative wealth owned very little housing wealth and were in the red because of loans or other unspecified debts. In contrast, households in debt owned houses with a value of over 50.000 euros on average by 2014. The amounts owed on these houses in the form of mortgages or loans exceeded the value of these homes by 20.000 euros per household on average. This is connected to the drops in housing values after the financial crisis. Households might have bought a house just before the crisis, and the value of their house dropped below the total amount still owed. Another possibility is that these households accumulated arrears in mortgage payments. Regardless of the pathway into negative wealth, the group of households that finds itself in a complicated financial situation has increased over time. In terms of residence-related debts, the situation seems to have improved a bit after 2014, but levels of debt remain high. On the other pages of this website, we explore the characteristics of these households (for example, their income, and the education and social background of household members).
Figure 3. Wealth Components of Households in Debt 2002-2017
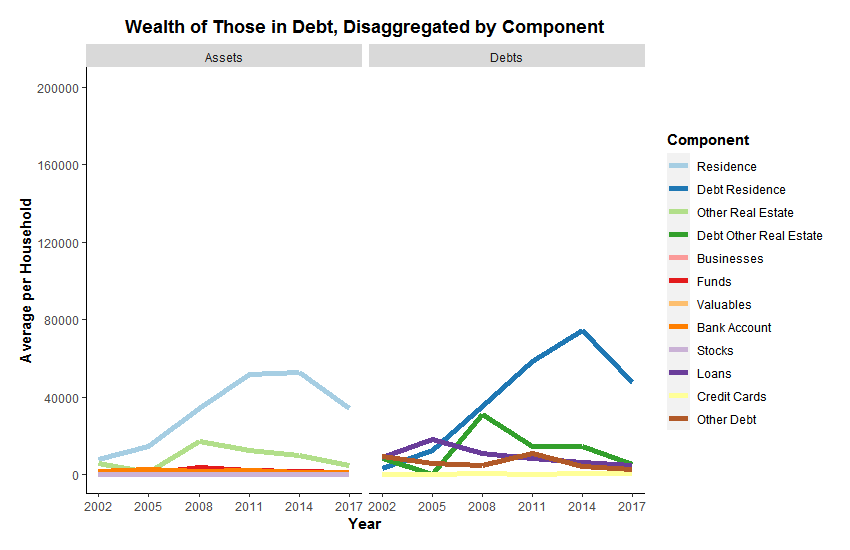
Source: Encuesta Financiera de Familias (Banco de España). In 2017 euros.
Increasing wealth inequality: Driven by the rich becoming richer?
Has the distribution of wealth become less equal in Spain over the last two decades? Figure 4 shows what part of all household wealth in Spain is owned by the 10% wealthiest households in the country. In fifteen years (2002-2017), the share of wealth owned by the wealthiest 10% rose from 43% to 54%. This means that the wealthiest 10% of households owned more wealth than the rest of Spanish households combined (the other 90%) in 2017.
Figure 4. Share of all household wealth held by wealthiest 10%
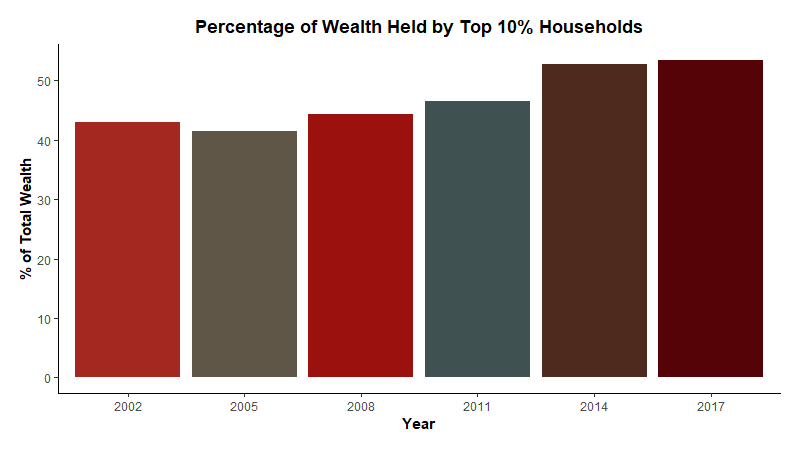
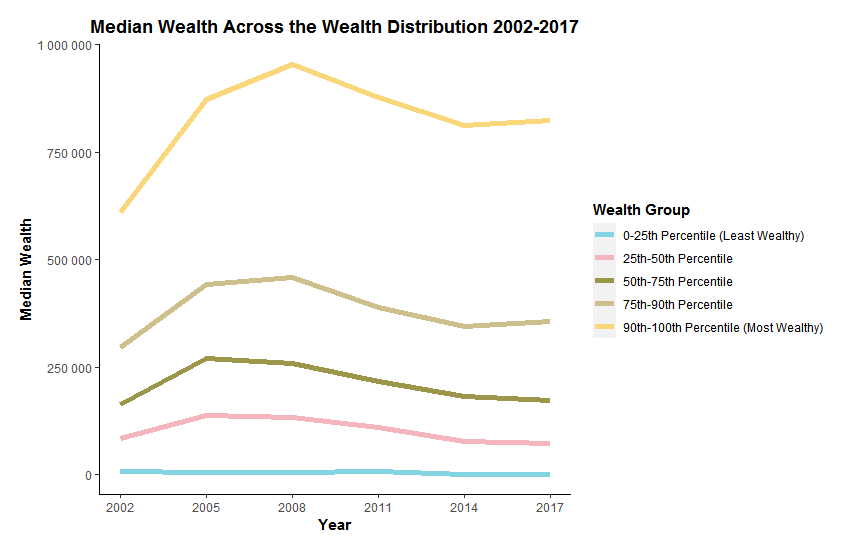
The biggest leap in inequality occurred between 2011 and 2014, a period where the consequences of the financial crisis hit Spain very hard. Figures 1 and 2 already showed that this was a period where housing values went down and the number of people living in households with negative or little wealth increased considerably. Figure 5 below indicates that the increases in wealth inequality are not so much produced by the 10% richest households becoming richer. Even the 10% wealthiest households lost considerable amounts of wealth after the financial crisis. However, the other 90% of households lost relatively more of their wealth during the same period. On the remaining pages of this website, we explore the characteristics of those who lost wealth after the financial crisis further.
Figure 5. Trends in median wealth of percentile groups
Discover more about wealth, its distribution across Spanish households, and the characteristics of individuals living in households with little and plenty of wealth by clicking on one of the buttons below.
A gentle introduction to the concept of wealth
FAQ: What is wealth and is wealth inequality important?
Basic trends in household wealth and its distribution in Spain
Who is gaining wealth, who is falling behind?
Income Education and Social Background
This project is financed by the “la Caixa” Social Research Call 2019 (SR0403-WINEQ)